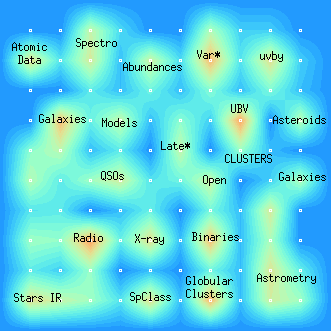
Each dot marks a map area; colour denotes the density or the clustering tendency of the documents; deep blue areas have the lowest density. Just click any area on the map to get the corresponding list of catalogues found in that area.

|
Each dot marks a map area; colour denotes the density or the clustering tendency of the documents; deep blue areas have the lowest density. Just click any area on the map to get the corresponding list of catalogues found in that area. |

|